A digital library for post-16 educators
AuthorEmma Fielding and Debbie BogardCategoriesTeaching, Policy and News

This piece was initially published on FFT Education Datalab's blog in 2020 here by Dave Thomson. Datalab are a team of education data analysts, using statistics to inform policymaking and school practices.
Our most widely read blogpost has been one we published in 2017 on the equivalence of A-Levels and BTECs. This suggested that the equivalences used by both UCAS and the Department for Education over-valued BTECs, and proposed a fairer method.
However, this used data from 2016 prior to reforms to vocational qualifications.
Has the equivalence between BTEC and A-Level changed as a result of these reforms?
Last year we showed that schools and colleges were reluctant to switch to the new style BTEC qualifications.
This can be seen in the numbers of pupils counted in 16-18 performance tables. The chart below shows the number of students counted as taking ‘applied general’ and ‘tech level’ qualifications for the 2016 to 2019 cohorts. (Most BTECs are classified as applied general qualifications but some are classified as tech levels, depending on the subject content. See here for more details.)
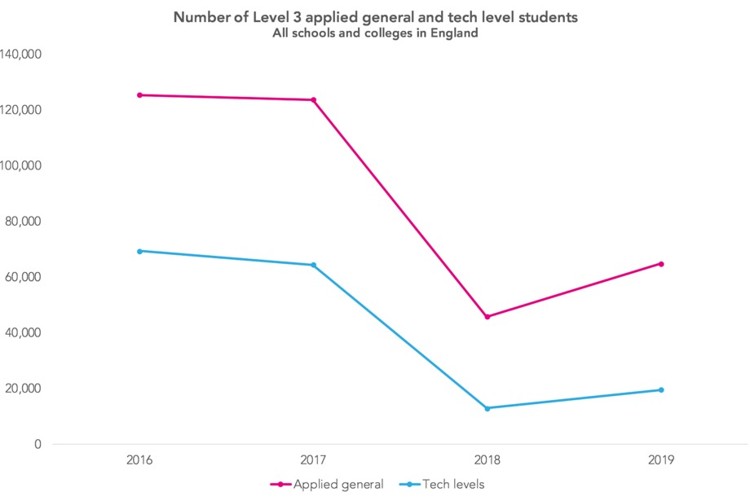
The number of students taking applied general qualifications fell from 125,000 in 2016 to 46,000 in 2018. Numbers taking tech level qualifications fell from 69,000 to 13,000. Provisional data for 2019 indicated a slight upturn but nowhere near back to 2016 levels.
The chart above only includes qualifications deemed eligible for performance tables. Legacy BTECs continued to be funded post-2017 (and will be so up to the end of 2021) and many schools and colleges continued to offer them. This included subjects that weren’t reformed (e.g. public services) as well as those that were.
If we were to include BTECs no longer considered eligible, the 2018 numbers of applied general students would be at least 62,000 higher than those stated above and 35,000 higher for tech level students.
In other words, the 16-18 performance tables do not seem to exert much influence over the behaviour of schools and colleges, certainly for pupils taking BTECs. This is quite unlike the case at Key Stage 4, where the Wolf review (and then Progress 8) led to wide-scale change in the qualifications schools offered.
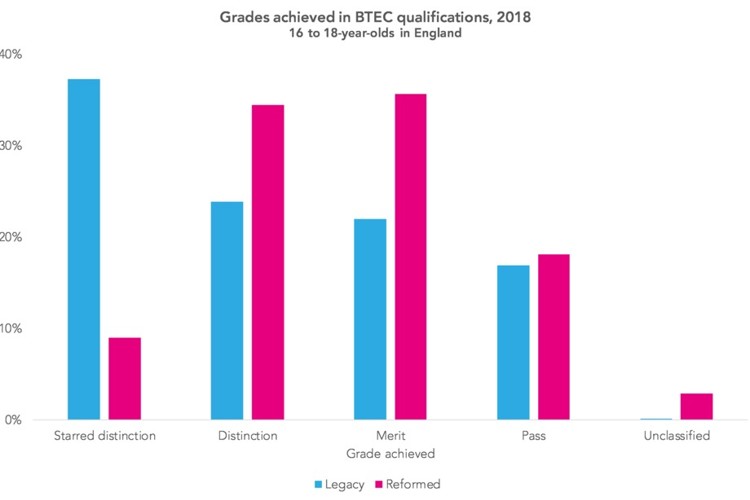
Grades awarded in the reformed BTECs tended to be lower than those awarded in legacy BTECs in 2018 as the following chart shows. Far fewer starred distinction grades were awarded in reformed BTECs (9% compared to 37% in legacy qualifications). A total of 70% of entries were awarded a distinction or merit post-reform.[1]
Some students entered a mix of A-Levels and BTECs in 2018: 17,000 entered at least one legacy BTEC and at least one A-Level, while 15,600 entered at least one reformed BTEC and at least one A-Level.
This means we can compare A-Level and BTEC results (Level 3 average point scores) for this set of pupils who entered both. The chart below shows the result of doing this.
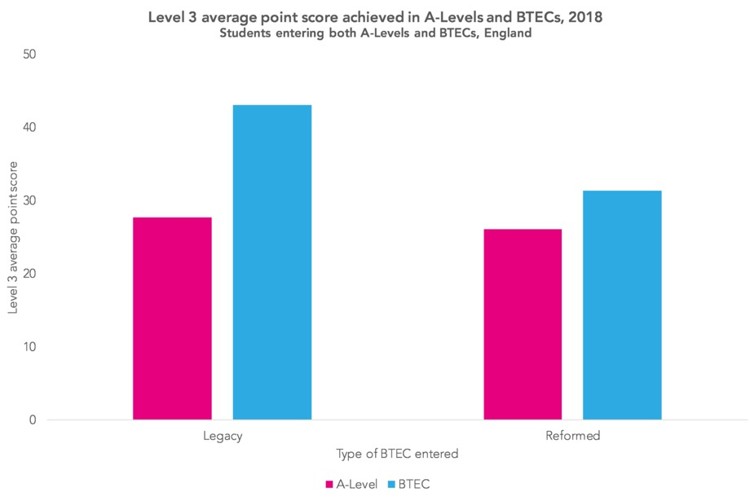
Students who entered legacy BTECs tended to achieve much higher Level 3 average point scores in those qualifications than in A-Levels.
On average, they achieved 43 points in BTECs – equivalent to between grade A and grade B at A-Level – while on average they achieved 28 points in A-Levels, or just below grade C. Putting it a another way, the difference of 15 points is equivalent to one and a half grades at A-Level.
For reformed BTECs the difference was much narrower among pupils: 5 points – equivalent to half a grade at A-Level.
It looks as if comparability has increased, then, even if perfect comparability has not quite been achieved.
To finish, we can look at the attainment of all pupils who took A-Levels or BTECs given their prior attainment at GCSE.
The next chart shows the position in 2017, prior to the reforms.
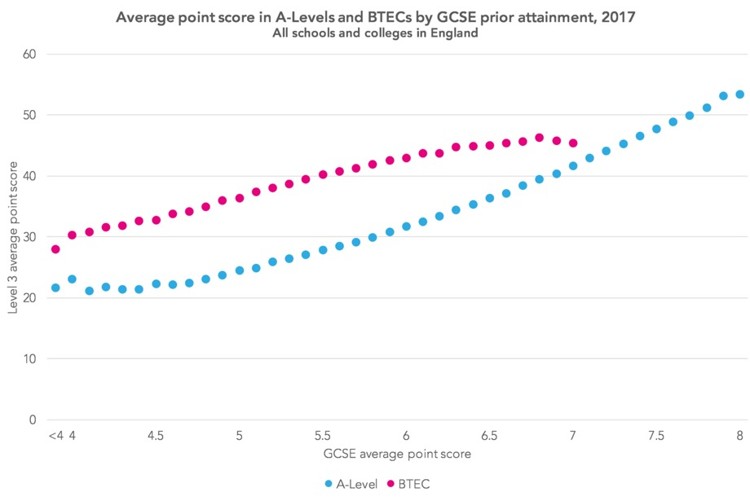
Across most of the prior attainment range, students tended to score much more highly in BTECs than in A-Levels. (No BTEC data is shown for pupils with GCSE average point scores of 7 or higher (grade A or above) due to small numbers of students.) Note that the maximum point score for BTEC is 50 (starred distinction) and for A-Level it is 60 (A*).
But differences between reformed BTECs and A-Levels in 2018 were much reduced, as the following chart shows.
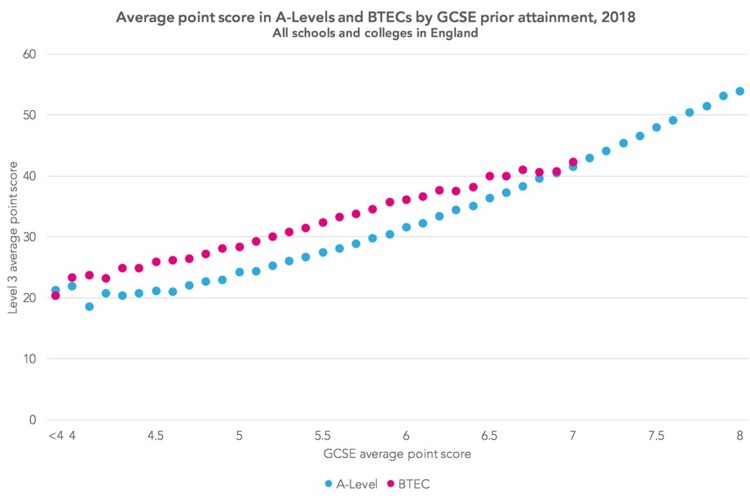
What can we conclude from this?
Grades awarded in reformed BTECs tend to be lower than those awarded in predecessor qualifications. This results in much closer comparability to A-Levels using DfE point score equivalences. That said, students still tend to achieve 5 points higher in BTECs – equivalent to half a grade at A-Level.
The downside of the changes is that take-up of reformed BTECs has been relatively slow. Many schools and colleges have continued to deliver predecessor qualifications. Up to now there have been no funding incentives to change and the incentive that publication of data in performance tables adds appears not to have had much effect.
1. Entries are weighted by qualification size here, e.g. a qualification equivalent to four A-Levels is counted as four entries.
Dave Thomson is chief statistician at the Datalab.
Update your browser to view this website correctly. Update my browser now